Market Outlook
November 21, 2017
Market Cues
Domestic Indices
Chg (%)
(Pts)
(Close)
Indian markets are likely to open flat tracking global indices and SGX Nifty.
BSE Sensex
0.1
17
33,360
U.S. markets rose on Monday as Wall Street bet tax cuts would keep the economic
Nifty
0.1
15
10,299
expansion going.
Mid Cap
0.6
104
16,778
The European markets got off to a weak start Monday, but managed to climb back
Small Cap
0.8
142
17,747
into positive territory before midday. Early weakness was due to political uncertainty
Bankex
(0.1)
(21)
29,221
in Germany, where talks to form a coalition government failed after the Free
Democratic Party had pulled out of negotiations with Angela Merkel's conservative
Global Indices
Chg (%)
(Pts)
(Close)
bloc.
Dow Jones
0.3
72
23,430
Indian markets finished marginally higher on Monday after two days of strong gains
Nasdaq
0.12
8
6,790
over last weekend following Moody's decision to upgrade India's sovereign rating for
FTSE
0.12
9
7,389
the first time in nearly 14 years.
Nikkei
(0.6)
(135)
22,262
News Analysis
Hang Seng
0.2
61
29,260
Quess Corp acquires majority stake in TBSS for `153cr
Shanghai Com
0.3
9
3,392
Detailed analysis on Pg2
Advances / Declines
BSE
NSE
Investor’s Ready Reckoner
Advances
1,640
1,109
Key Domestic & Global Indicators
Declines
1,066
632
Stock Watch: Latest investment recommendations on 150+ stocks
Unchanged
161
75
Refer Pg5 onwards
Top Picks
Volumes (` Cr)
CMP
Target
Upside
Company
Sector
Rating
BSE
4,676
(`)
(`)
(%)
Blue Star
Capital Goods
Buy
702
867
23.6
NSE
27,899
Dewan Housing Finance
Financials
Accumulate
639
712
11.5
Asian Granito
Other
Buy
494
570
15.4
Net Inflows (` Cr)
Net
Mtd
Ytd
Navkar Corporation
Other
Buy
190
265
39.4
FII
289
14,403
52,855
KEI Industries
Capital Goods Accumulate
335
380
13.4
MFs
2,326
3,825
99,236
More Top Picks on Pg4
Key Upcoming Events
Top Gainers
Price (`)
Chg (%)
Previous
Consensus
Date
Region
Event Description
Reading
Expectations
Rtnpower
9
15.7
Nov21
US
Existing home sales
5.39
5.40
Bfutilitie
506
8.3
Nov22
US
Initial Jobless claims
249.00
240.00
Ibrealest
233
7.3
Nov22
Germany GDP nsa (YoY)
2.30
2.30
Gmdcltd
170
7.3
Nov23
Euro Zone Euro-Zone Consumer Confidence
(1.00)
(0.90)
Biocon
423
7.3
Nov23
Germany PMI Services
54.70
55.00
More Events on Pg7
Top Losers
Price (`)
Chg (%)
Jklakshmi
408
(4.6)
Shreecem
17,529
(4.2)
Ambujacem
265
(3.4)
Acc
1,706
(3.4)
Ramcocem
703
(3.2)
As on November, 20 2017
Market Outlook
November 21, 2017
News Analysis
Quess Corp acquires majority stake in TBSS for `153cr
Prem Watsa backed Quess Corp has acquired a majority stake in Tata Group's
domestic-focused back-office firm Tata Business Support Services (TBSS) for
`153cr, plugging a gap in offering customer services to its customers in India.
TBSS, based in Hyderabad, employs over 27,000 people handling over 500
million customer transactions a year. The firm has 27 delivery centres, with
customers in auto, banking, telecom, media and retail and offering Quess a pan
India presence.
Quess will own 51% in the company, which will be rebranded with a new identity,
while Tata Sons, the promoter of TBSS, will retain 49%.The Bengaluru-based
Quess has built its business through acquisitions, buying over 15 companies in the
last five years.
In October, the company is spending around `40cr to buy 70% stake in Vedang
Cellular Services, a firm that builds telecom network products. It also announced a
joint venture with Trimax IT infrastructure and services to implement a smart city
project in Ahmedabad.
Economic and Political News
Government likely to dilute proposed labour reforms
India, World Bank ink loan pact worth $98 mn for clean energy projects
Govt may impose $700-800/tonne MEP on onion to curb exports
Corporate News
Wipro's `11,000cr share buyback to open on Nov 29
M&M to expand footprint in `1,000cr e-rickshaw market
Gayatri Projects eyes 30% top-line growth in 3-4 years on strong order flow
Market Outlook
November 21, 2017
Top Picks HHHHH
Market Cap
CMP
Target
Upside
Company
Rationale
(` Cr)
(`)
(`)
(%)
Strong growth in domestic business due to its leade`hip
in acute therapeutic segment. Alkem expects to launch
Alkem Laboratories
23,388
1,956
2,125
8.6
more products in USA, which bodes for its international
business.
We expect the company would report strong profitability
Asian Granito
1,486
494
570
15.4
owing to better product mix, higher B2C sales and
amalgamation synergy.
Favorable outlook for the AC industry to augur well for
Cooling products business which is out pacing the
Blue Star
6,724
702
867
23.6
market growth. EMPPAC division's profitability to
improve once operating environment turns around.
With a focus on the low and medium income (LMI)
consumer segment, the company has increased its
Dewan Housing Finance
20,025
639
712
11.5
presence in tier-II & III cities where the growth
opportunity is immense.
Loan growth is likely to pick up after a sluggish FY17.
Lower credit cost will help in strong bottom-line growth.
Karur Vysya Bank
7,291
121
180
49.2
Increasing share of CASA will help in NIM
improvement.
High order book execution in EPC segment, rising B2C
KEI Industries
2,626
335
380
13.4
sales and higher exports to boost the revenues and
profitability
Expected to benefit from the lower capex requirement
Music Broadcast
2,113
370
434
17.2
and 15 year long radio broadcast licensing.
Massive capacity expansion along with rail advantage
Navkar Corporation
2,861
190
265
39.4
at ICD as well CFS augur well for the company
Strong brands and distribution network would boost
Siyaram Silk Mills
2,711
579
650
12.4
growth going ahead. Stock currently trades at an
inexpensive valuation.
Market leadership in Hindi news genre and no.
2
viewership ranking in English news genre, exit from the
TV Today Network
2,234
374
435
16.2
radio business, and anticipated growth in ad spends by
corporate to benefit the stock.
After GST, the company is expected to see higher
volumes along with improving product mix. The Gujarat
Maruti Suzuki
2,54,463
8,424
8,890
5.5
plant will also enable higher operating leverage which
will be margin accretive.
We expect loan book to grow at 24.3% over next two
GIC Housing
2,351
437
655
50.1
year; change in borrowing mix will help in NIM
improvement..
Source: Company, Angel Research
Market Outlook
November 21, 2017
Key Upcoming Events
Global economic events release calendar
Bloomberg Data
Date
Time Country
Event Description
Unit
Period
Last Reported
Estimated
Nov 21, 2017
8:30 PMUS
Existing home sales
Million
Oct
5.39
5.40
Nov 22, 2017
7:00 PMUS
Initial Jobless claims
Thousands
Nov 18
249.00
240.00
12:30 PMGermany
GDP nsa (YoY)
% Change
3Q F
2.30
2.30
Nov 23, 2017
8:30 PMEuro Zone
Euro-Zone Consumer Confidence
Value
Nov A
(1.00)
(0.90)
2:00 PMGermany
PMI Services
Value
Nov P
54.70
55.00
8:30 PMUS
New home sales
Thousands
Oct
667.00
617.50
2:00 PMGermany
PMI Manufacturing
Value
Nov P
60.60
60.40
Nov 27, 2017
3:00 PMUK
GDP (YoY)
% Change
3Q P
1.50
1.50
Nov 28, 2017
8:30 PMUS
Consumer Confidence
S.A./ 1985=100
Nov
125.90
124.00
Nov 29, 2017
7:00 PMUS
GDP Qoq (Annualised)
% Change
3Q S
3.00
3.30
Nov 30, 2017
2:25 PMGermany
Unemployment change (000's)
Thousands
Nov
(11.00)
6:30 AMChina
PMI Manufacturing
Value
Nov
51.60
Dec 01, 2017
3:00 PMUK
PMI Manufacturing
Value
Nov
56.30
Dec 05, 2017
3:30 PMEuro Zone
Euro-Zone GDP s.a. (QoQ)
% Change
3Q F
0.60
Dec 06, 2017
2:30 PMIndia
RBI Reverse Repo rate
%
Dec 6
5.75
2:30 PMIndia
RBI Repo rate
%
Dec 6
6.00
2:30 PMIndia
RBI Cash Reserve ratio
%
Dec 6
4.00
Dec 08, 2017
India
Imports YoY%
% Change
Nov
7.60
3:00 PMUK
Industrial Production (YoY)
% Change
Oct
2.50
India
Exports YoY%
% Change
Nov
(1.10)
China
Exports YoY%
% Change
Nov
6.90
7:00 PMUS
Change in Nonfarm payrolls
Thousands
Nov
261.00
7:00 PMUS
Unnemployment rate
%
Nov
4.10
Dec 09, 2017
7:00 AMChina
Consumer Price Index (YoY)
% Change
Nov
1.90
Source: Bloomberg, Angel Research
Market Outlook
November 21, 2017
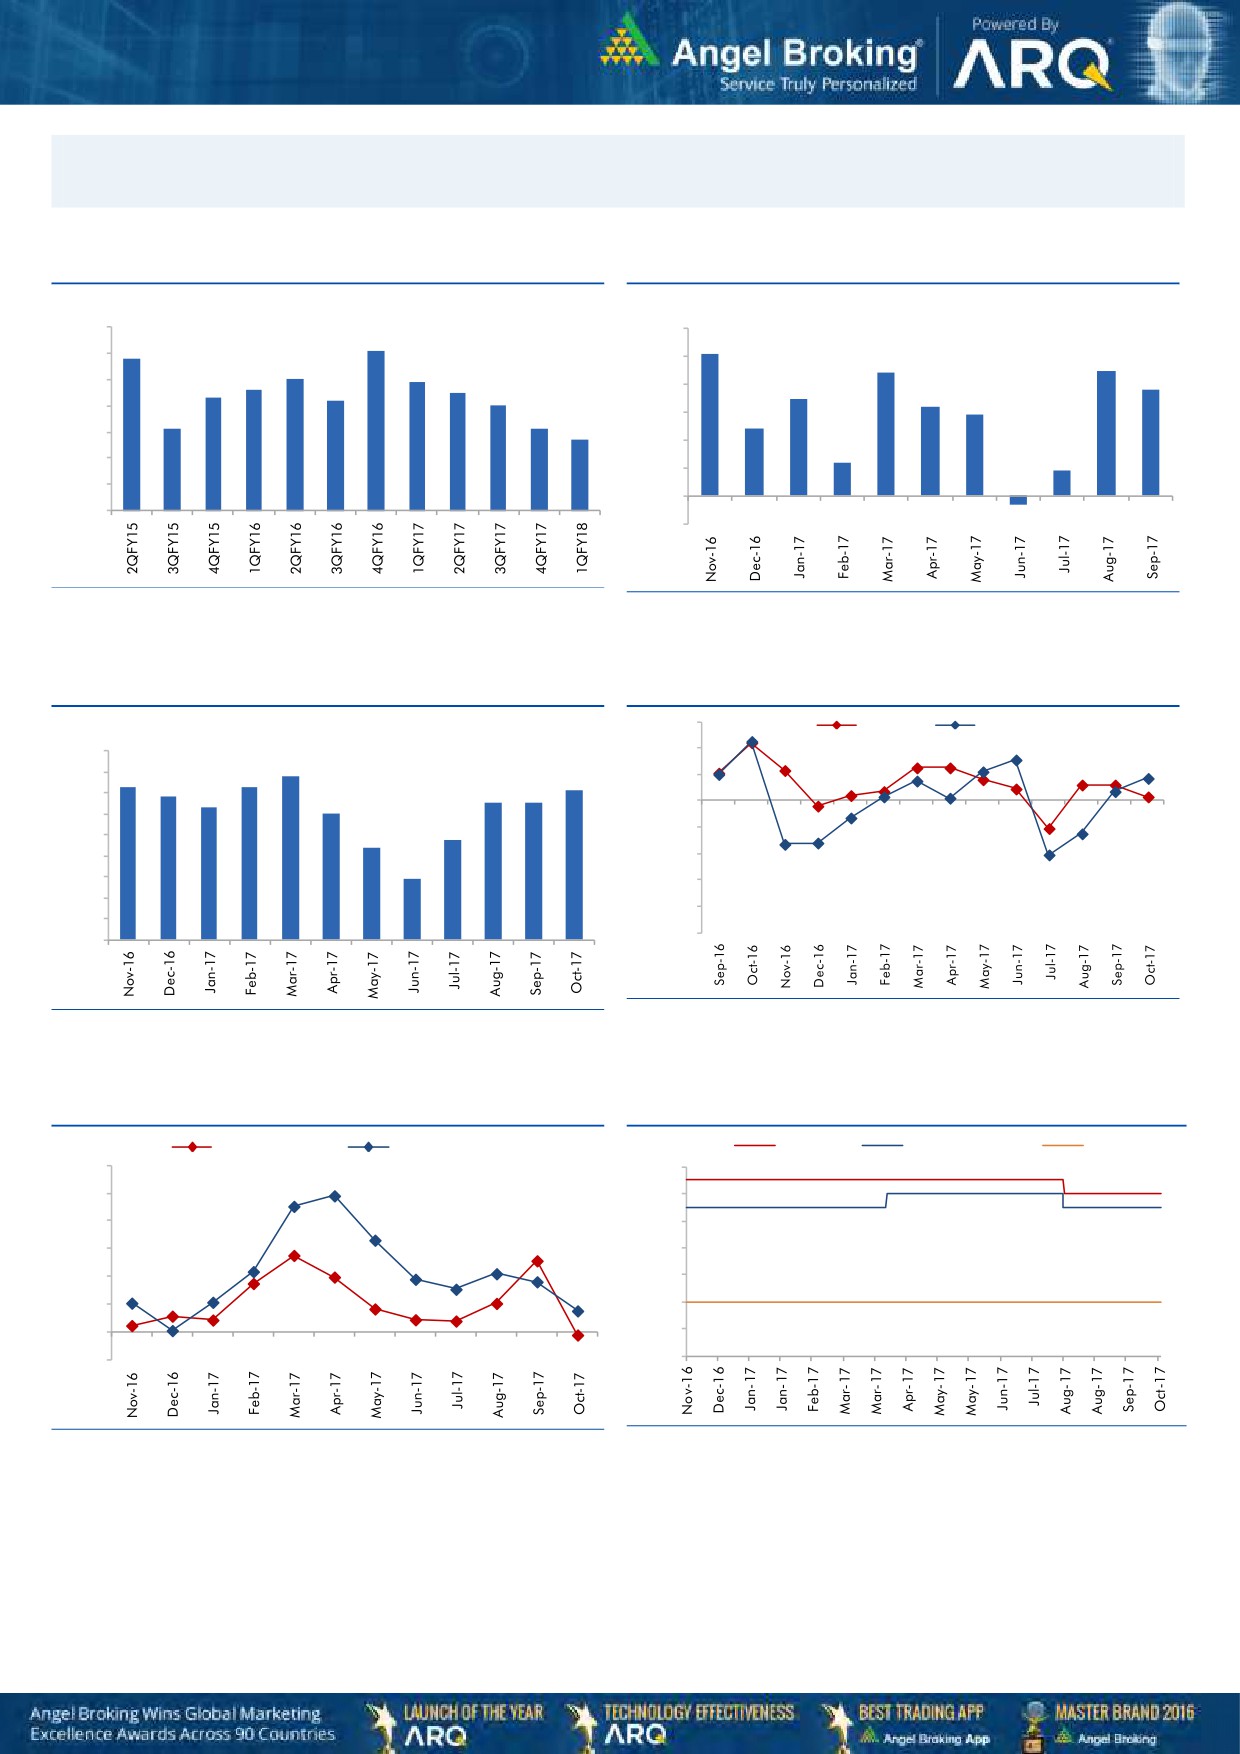
Macro watch
Exhibit 1: Quarterly GDP trends
Exhibit 2: IIP trends
(%)
(%)
10.0
6.0
9.1
5.1
8.8
9.0
5.0
4.4
4.5
8.0
7.9
7.6
7.5
3.8
8.0
7.3
7.2
4.0
3.5
7.0
3.2
2.9
7.0
6.1
6.1
3.0
2.4
5.7
6.0
2.0
1.2
5.0
0.9
1.0
4.0
-
3.0
(1.0)
(0.3)
Source: CSO, Angel Research
Source: MOSPI, Angel Research
Exhibit 3: Monthly CPI inflation trends
Exhibit 4: Manufacturing and services PMI
56.0
Mfg. PMI
Services PMI
(%)
4.5
54.0
3.9
4.0
3.6
3.7
3.6
52.0
3.4
3.2
3.3
3.3
3.5
3.0
50.0
3.0
2.4
48.0
2.5
2.2
2.0
46.0
1.5
1.5
44.0
1.0
42.0
0.5
40.0
-
Source: Market, Angel Research; Note: Level above 50 indicates expansion
Source: MOSPI, Angel Research
Exhibit 5: Exports and imports growth trends
Exhibit 6: Key policy rates
(%)
Exports yoy growth
Imports yoy growth
(%)
Repo rate
Reverse Repo rate
CRR
60.0
6.50
50.0
6.00
40.0
5.50
30.0
5.00
20.0
4.50
10.0
4.00
0.0
3.50
(10.0)
3.00
Source: Bloomberg, Angel Research
Source: RBI, Angel Research
Market Outlook
November 21, 2017
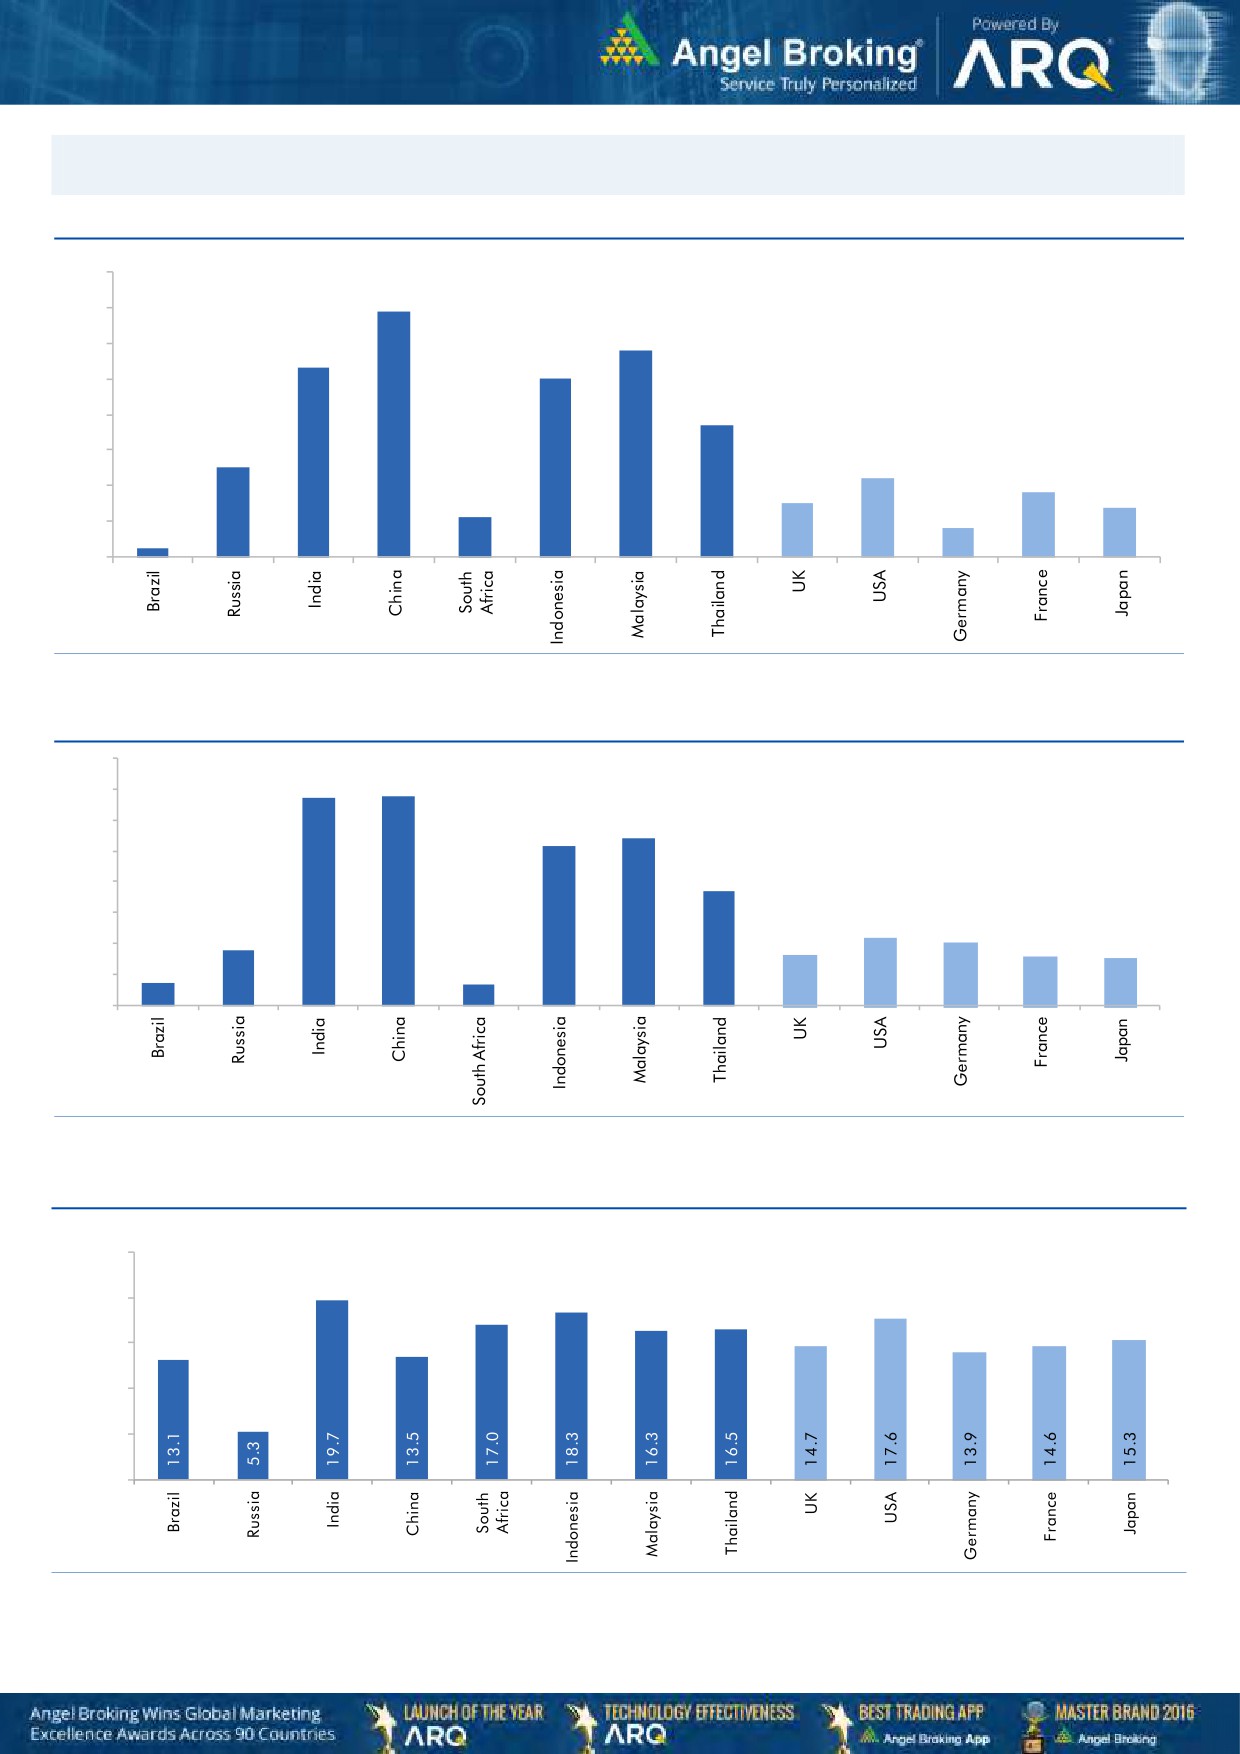
Global watch
Exhibit 1: Latest quarterly GDP Growth (%, yoy) across select developing and developed countries
(%)
8.0
6.9
7.0
5.8
6.0
5.3
5.0
5.0
1.1
3.7
4.0
2.5
3.0
2.2
1.8
2.0
1.5
1.4
0.8
1.0
0.3
-
Source: Bloomberg, Angel Research
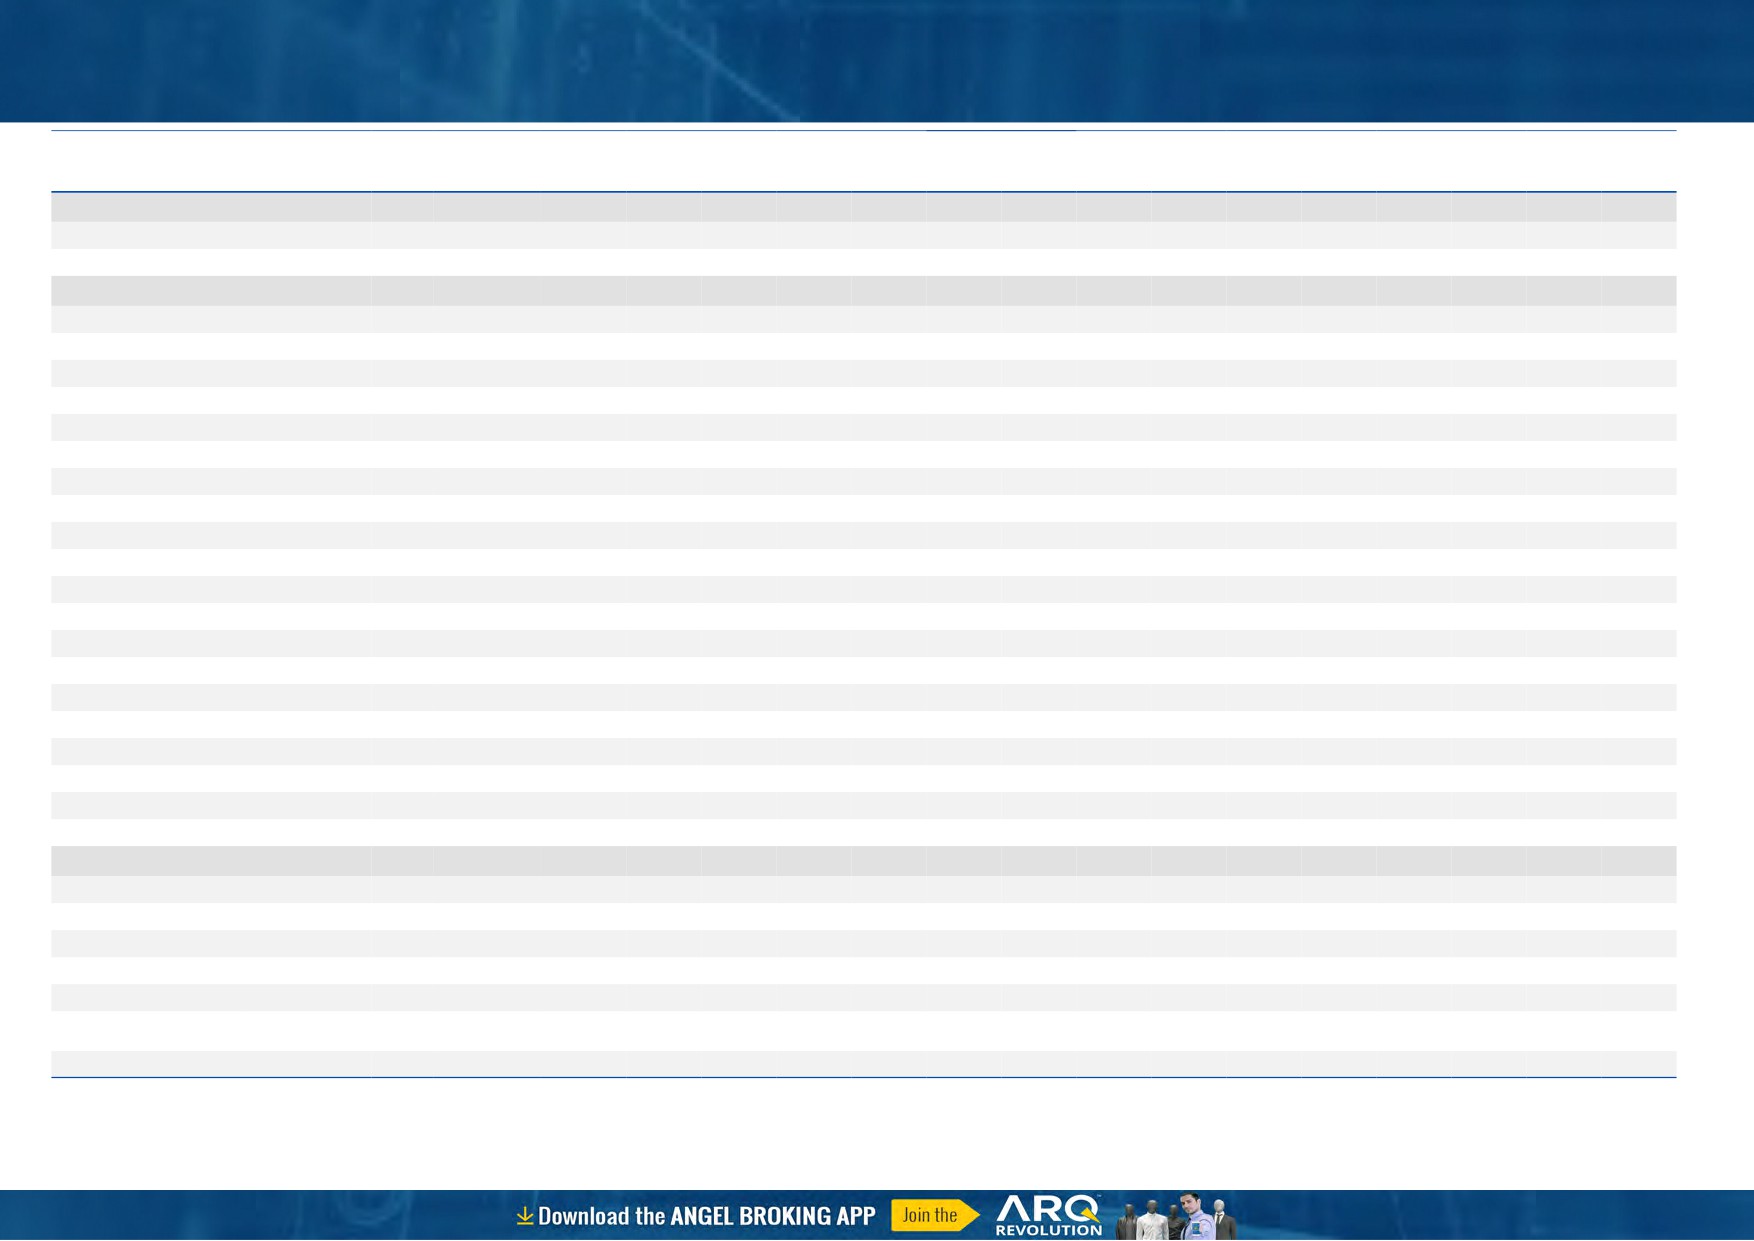
Exhibit 2: 2017 GDP Growth projection by IMF (%, yoy) across select developing and developed countries
(%)
6.7
6.8
7.0
6.0
5.4
5.2
5.0
3.7
4.0
3.0
1.8
2.2
2.0
1.7
1.6
2.0
0.7
1.5
0.7
1.0
-
Source: IMF, Angel Research
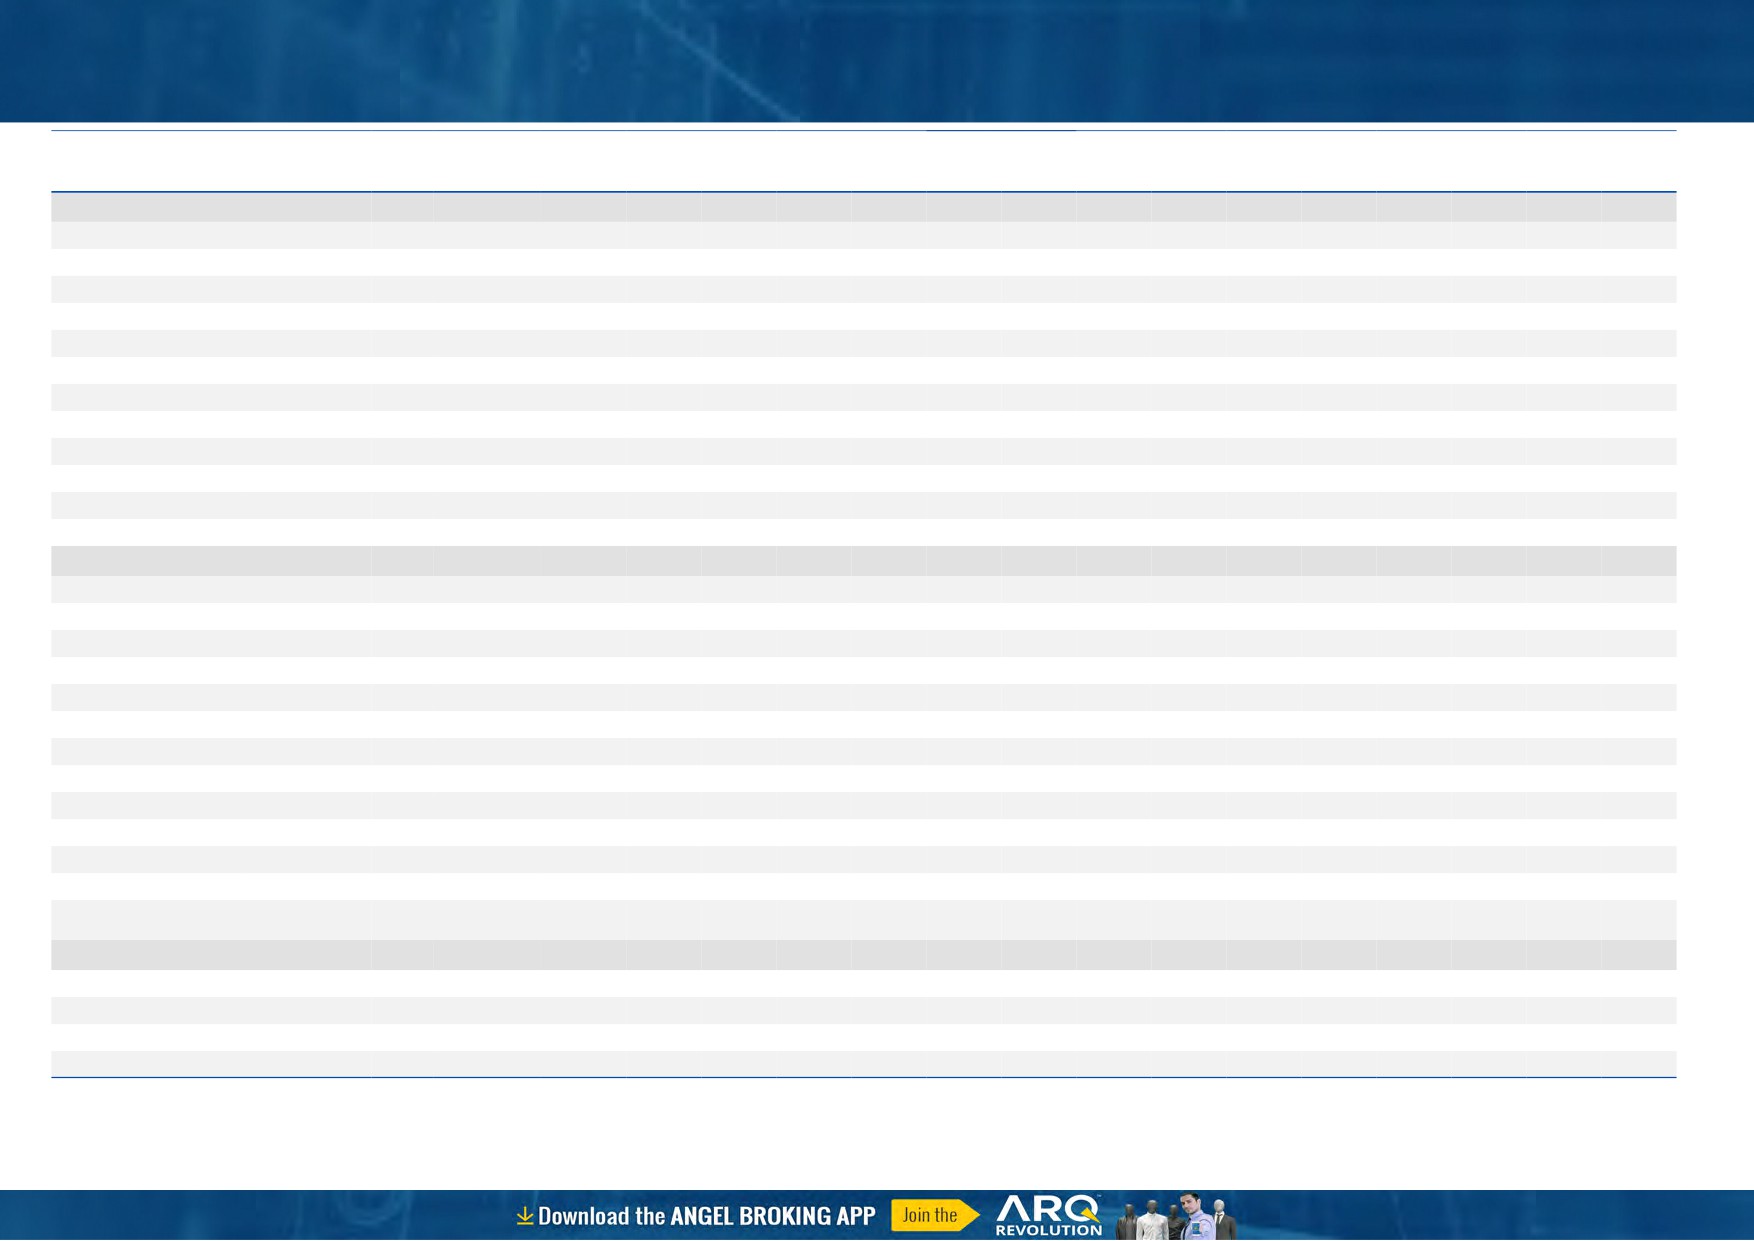
Exhibit 3: One year forward P-E ratio across select developing and developed countries
(x)
25.0
20.0
15.0
10.0
5.0
-
Source: IMF, Angel Research
Stock Watch
November 21, 2017
Company Name
Reco
CMP
Target
Mkt Cap
Sales ( Čcr )
OPM(%)
EPS (Č)
PER(x)
P/BV(x)
RoE(%)
EV/Sales(x)
(Č)
Price ( Č)
( Č cr )
FY18E FY19E
FY18E
FY19E
FY18E
FY19E
FY18E
FY19E
FY18E
FY19E
FY18E
FY19E
FY18E
FY19E
Agri / Agri Chemical
Rallis
Reduce
230
209
4,473
1,873
2,099
15.0
15.0
9.5
10.5
24.2
21.9
3.7
3.3
15.8
16.0
2.3
2.1
United Phosphorus
Accumulate
729
820
37,041
18,922
21,949
18.0
18.5
36.2
45.6
20.1
16.0
4.2
3.5
22.7
23.8
2.1
1.8
Auto & Auto Ancillary
Ashok Leyland
Accumulate
115
127
33,647
23,339
27,240
10.1
10.8
4.7
6.2
24.7
18.5
4.9
4.4
20.0
23.6
1.4
1.2
Bajaj Auto
Neutral
3,243
-
93,837
23,936
27,955
19.5
20.1
142.7
167.3
22.7
19.4
4.9
4.4
21.8
22.8
3.5
2.9
Bharat Forge
Buy
698
875
32,489
7,637
8,755
21.7
23.2
36.1
47.3
19.3
14.8
3.5
3.0
18.5
20.8
4.1
3.5
Eicher Motors
Neutral
30,650
-
83,438
19,043
22,837
19.5
19.9
835.4
1,019.0
36.7
30.1
13.7
10.6
40.9
37.8
4.3
3.5
Gabriel India
Neutral
193
-
2,772
1,782
2,033
9.7
10.2
7.1
8.9
27.2
21.8
5.5
4.6
21.0
22.2
1.5
1.3
Hero Motocorp
Accumulate
3,659
4,129
73,063
32,239
36,878
16.0
15.6
184.4
206.5
19.8
17.7
6.2
5.5
31.3
30.7
2.1
1.8
Jamna Auto Industries Neutral
60
-
2,397
1,441
1,662
14.4
14.8
13.9
17.6
4.3
3.4
1.2
1.0
30.0
31.0
1.7
1.4
Mahindra and Mahindra Neutral
1,408
-
87,546
46,971
53,816
13.6
14.0
67.7
79.8
20.8
17.7
3.0
2.7
15.0
15.9
1.8
1.5
Maruti
Accumulate
8,424
8,890
254,463
80,985
97,917
15.6
16.9
282.3
370.4
29.8
22.7
6.5
5.3
21.8
23.1
2.8
2.2
Minda Industries
Neutral
1,094
-
9,453
4,328
5,084
11.0
11.9
27.3
36.4
40.1
30.1
8.5
6.7
23.1
25.6
2.3
1.9
Motherson Sumi
Neutral
358
-
75,333
55,937
64,445
10.8
11.4
16.9
21.1
21.2
17.0
4.7
4.8
25.2
25.4
1.4
1.2
Tata Motors
Neutral
422
-
121,962
303,167
343,649
11.8
13.8
33.1
54.7
12.8
7.7
2.1
1.7
16.9
23.0
0.5
0.4
TVS Motor
Neutral
709
-
33,669
13,992
16,216
9.0
9.4
17.1
20.3
41.6
34.9
11.0
8.5
29.7
27.7
2.3
2.0
Amara Raja Batteries
Accumulate
804
858
13,730
6,140
7,122
14.3
15.6
29.3
39.0
27.4
20.6
4.7
3.9
17.1
19.0
2.2
1.9
Exide Industries
Neutral
201
-
17,123
8,689
9,854
15.1
15.2
9.7
11.0
20.9
18.3
3.7
3.3
15.7
16.1
1.7
1.5
Apollo Tyres
Neutral
236
-
13,472
15,739
17,326
13.3
14.6
20.4
26.7
11.5
8.8
1.4
1.2
20.4
26.7
1.1
1.0
Ceat
Neutral
1,777
-
7,186
6,661
7,717
11.1
14.2
116.2
178.2
15.3
10.0
2.7
2.2
15.2
21.3
1.2
1.0
JK Tyres
Neutral
144
-
3,273
8,318
9,239
16.2
16.4
21.0
27.5
6.9
5.3
1.3
1.1
19.1
20.4
0.8
0.7
Swaraj Engines
Neutral
1,903
-
2,364
788
889
16.4
16.5
71.6
81.0
26.6
23.5
7.7
7.1
29.6
31.0
2.7
2.3
Subros
Neutral
248
-
1,488
1,855
2,135
11.6
11.8
10.3
14.7
24.2
16.9
3.7
3.2
15.8
19.1
1.0
0.9
Capital Goods
BEML
Neutral
1,626
-
6,770
4,286
5,194
7.1
8.2
42.9
58.1
37.9
28.0
3.1
2.8
7.6
8.7
1.6
1.3
Bharat Electronics
Neutral
180
-
44,128
10,258
12,470
19.6
19.5
7.3
8.6
24.6
20.9
0.5
0.4
20.4
21.9
3.8
3.1
Voltas
Neutral
629
-
20,828
6,778
8,004
9.6
11.0
17.1
22.4
36.8
28.1
8.8
7.7
17.7
19.8
2.8
2.3
BHEL
Neutral
87
-
32,033
33,200
39,167
6.8
9.5
6.2
11.2
14.1
7.8
0.7
0.6
4.6
8.0
0.5
0.4
Blue Star
Buy
702
867
6,724
5,220
6,207
6.3
6.6
16.8
22.3
41.8
31.5
8.3
7.3
19.9
23.3
1.3
1.0
CG Power and Industrial
Neutral
84
-
5,265
6,555
7,292
7.5
7.5
-
0.8
8,400.0
105.0
1.3
1.3
0.1
1.2
0.9
0.8
Solutions
Greaves Cotton
Neutral
122
-
2,978
1,778
1,993
14.7
15.1
8.1
9.1
15.1
13.4
3.4
3.2
21.8
23.6
1.4
1.3
Stock Watch
November 21, 2017
Company Name
Reco
CMP
Target
Mkt Cap
Sales ( Čcr )
OPM(%)
EPS (Č)
PER(x)
P/BV(x)
RoE(%)
EV/Sales(x)
(Č)
Price ( Č)
( Č cr )
FY18E FY19E
FY18E
FY19E
FY18E
FY19E
FY18E
FY19E
FY18E
FY19E
FY18E
FY19E
FY18E
FY19E
Capital Goods
KEC International
Buy
296
350
7,610
9,779
11,113
9.4
9.8
14.2
18.2
20.9
16.3
4.0
3.3
21.1
22.1
1.0
0.9
KEI Industries
Accumulate
335
380
2,626
3,001
3,391
10.0
10.0
13.0
16.1
25.8
20.8
4.7
3.9
18.2
18.7
1.1
0.9
Thermax
Neutral
1,020
-
12,155
4,125
4,747
10.3
10.8
26.7
31.5
38.2
32.4
4.3
3.9
11.2
12.0
2.7
2.3
VATech Wabag
Buy
550
681
3,001
3,867
4,126
9.6
10.0
34.9
39.8
15.8
13.8
2.6
2.2
17.7
17.5
0.8
0.7
Cement
ACC
Neutral
1,706
-
32,042
12,255
13,350
13.5
14.3
58.0
66.2
29.4
25.8
3.5
3.3
11.5
12.2
2.6
2.4
Ambuja Cements
Neutral
265
-
52,620
10,250
11,450
17.5
19.0
7.2
8.3
36.8
31.9
2.6
2.5
7.0
7.8
4.9
4.3
India Cements
Neutral
171
-
5,277
6,135
6,750
14.8
15.2
8.5
11.5
20.2
14.9
1.0
1.0
4.8
6.2
1.2
1.1
JK Cement
Neutral
1,031
-
7,209
4,150
4,775
19.2
20.0
49.0
63.5
21.0
16.2
3.3
2.9
17.0
18.5
2.2
1.8
J K Lakshmi Cement
Neutral
408
-
4,806
3,422
3,757
15.5
17.0
13.5
23.2
30.3
17.6
3.1
2.7
10.8
15.5
1.8
1.6
Orient Cement
Neutral
165
-
3,389
2,215
3,233
16.8
17.0
5.9
6.9
28.0
24.0
2.1
2.0
10.8
10.1
2.5
1.7
UltraTech Cement
Neutral
4,193
-
115,115
28,250
35,150
20.2
23.5
77.5
122.2
54.1
34.3
4.6
4.1
9.6
14.8
4.5
3.6
Construction
KNR Constructions
Neutral
269
-
3,789
1,846
2,203
14.5
14.5
12.1
13.7
22.3
19.7
1.2
1.1
17.5
16.7
2.1
1.7
Larsen & Toubro
Neutral
1,228
-
171,952
95,787
109,476
10.2
11.6
44.5
50.8
27.6
24.2
3.5
3.2
12.9
13.1
2.3
2.1
Gujarat Pipavav Port
Neutral
132
-
6,393
739
842
61.6
62.7
5.1
6.2
25.9
21.5
3.2
3.2
12.7
14.9
8.1
7.0
PNC Infratech
Neutral
183
-
4,695
2,040
2,935
13.0
13.0
6.4
9.0
28.6
20.3
0.7
0.7
9.7
12.2
2.3
1.7
Simplex Infra
Neutral
522
-
2,582
6,012
6,619
11.6
11.7
21.1
31.0
24.8
16.9
1.7
1.6
6.5
8.6
1.0
0.9
Sadbhav Engineering
Neutral
318
-
5,447
3,823
4,426
10.7
10.8
10.3
11.8
30.8
26.9
3.7
3.2
10.1
10.5
1.7
1.5
NBCC
Neutral
265
-
23,859
9,099
12,706
6.4
6.4
7.3
9.6
36.4
27.7
1.6
1.3
27.5
30.5
2.5
1.8
MEP Infra
Neutral
102
-
1,650
2,403
2,910
18.3
16.8
2.4
6.1
43.2
16.7
16.4
11.0
35.2
55.8
1.8
1.5
SIPL
Neutral
137
-
4,834
2,060
2,390
46.8
47.7
(5.8)
(3.1)
5.1
5.9
(14.2)
(2.3)
7.1
6.6
Engineers India
Neutral
187
-
12,632
1,795
2,611
21.1
22.4
5.9
8.1
31.8
23.1
2.3
2.2
12.9
16.1
5.4
3.6
Financials
Axis Bank
Accumulate
545
580
130,659
32,558
35,843
3.5
3.2
27.8
41.0
19.6
13.3
2.1
1.9
11.4
14.9
-
-
Bank of Baroda
Neutral
185
-
42,512
22,533
26,079
2.4
2.4
12.0
20.9
15.4
8.8
1.0
0.9
6.6
11.0
-
-
Canara Bank
Neutral
393
-
23,474
17,925
20,235
2.0
2.1
18.5
36.5
21.2
10.8
0.8
0.8
3.4
6.2
-
-
Can Fin Homes
Neutral
474
-
6,306
586
741
3.5
3.5
107.8
141.0
4.4
3.4
1.0
0.8
24.1
25.6
-
-
Cholamandalam Inv. &
Neutral
1,287
-
20,112
2,826
3,307
6.3
6.3
53.7
64.6
24.0
19.9
4.1
3.5
18.3
18.9
-
-
Fin. Co.
Dewan Housing Finance Accumulate
639
712
20,025
2,676
3,383
2.4
2.7
37.4
49.7
17.1
12.9
2.2
2.0
13.8
16.2
-
-
Equitas Holdings
Buy
147
235
4,975
1,125
1,380
9.6
9.8
1.5
6.0
97.7
24.4
2.2
2.1
2.4
8.2
-
-
Federal Bank
Accumulate
113
125
22,153
4,896
5,930
2.8
3.1
5.4
7.6
21.1
15.0
1.8
1.6
8.5
11.0
-
-
Stock Watch
November 21, 2017
Company Name
Reco
CMP
Target
Mkt Cap
Sales ( Čcr )
OPM(%)
EPS (Č)
PER(x)
P/BV(x)
RoE(%)
EV/Sales(x)
(Č)
Price ( Č)
( Č cr )
FY18E FY19E
FY18E
FY19E
FY18E
FY19E
FY18E
FY19E
FY18E
FY19E
FY18E
FY19E
FY18E
FY19E
Financials
GIC Housing
Buy
437
655
2,351
376
477
3.6
3.7
33.0
40.0
13.2
10.9
2.4
2.0
20.0
23.0
-
-
HDFC Bank
Neutral
1,837
-
475,032
55,236
63,253
4.5
4.4
68.9
82.4
26.7
22.3
4.6
3.9
18.7
18.5
-
-
ICICI Bank
Neutral
319
-
204,449
42,361
51,378
3.6
3.9
18.4
25.7
17.3
12.4
1.9
1.8
11.3
15.0
-
-
Karur Vysya Bank
Buy
121
180
7,291
3,289
3,630
3.7
3.9
10.8
14.1
11.1
8.6
1.3
1.2
12.5
14.7
-
-
LIC Housing Finance
Neutral
605
-
30,555
4,895
6,332
3.4
3.7
50.7
66.8
11.9
9.1
2.4
2.0
21.7
23.8
-
-
Punjab Natl.Bank
Neutral
187
-
39,878
23,708
25,758
2.1
2.1
5.9
16.4
31.9
11.4
0.9
0.9
3.0
8.3
-
-
RBL Bank
Neutral
514
-
21,406
2,309
2,888
2.6
2.5
16.4
19.1
31.4
27.0
3.9
3.5
13.3
13.8
-
-
Repco Home Finance
Buy
626
825
3,919
496
597
4.4
4.2
38.5
48.7
16.3
12.9
2.9
2.4
19.6
20.6
-
-
South Ind.Bank
Neutral
31
-
5,679
3,195
3,567
3.0
3.1
3.0
3.8
10.4
8.2
1.0
0.9
10.5
11.9
-
-
St Bk of India
Neutral
333
-
287,491
105,827
121,056
2.4
2.5
16.1
25.6
20.7
13.0
1.6
1.5
6.6
9.9
-
-
Union Bank
Neutral
171
-
12,393
14,650
16,225
2.3
2.3
23.1
32.5
7.4
5.3
0.6
0.5
7.1
9.2
-
-
Yes Bank
Neutral
313
-
71,851
11,088
13,138
3.0
2.9
84.0
99.3
3.7
3.2
0.6
0.5
16.3
16.8
-
-
FMCG
Akzo Nobel India
Neutral
1,765
-
8,465
3,164
3,607
13.8
13.7
58.6
67.9
30.1
26.0
7.4
6.5
24.5
25.1
2.5
2.2
Asian Paints
Neutral
1,168
-
112,044
17,603
20,615
18.6
18.6
2,128.9
2,543.3
0.6
0.5
11.6
9.7
28.0
28.9
6.2
5.2
Britannia
Neutral
4,758
-
57,123
9,690
11,278
14.8
15.4
84.0
101.0
56.6
47.1
20.6
16.4
40.6
39.0
5.9
5.0
Colgate
Neutral
1,044
-
28,408
4,420
5,074
24.9
25.3
28.6
32.8
36.5
31.8
14.4
11.6
43.8
40.5
6.2
5.3
Dabur India
Neutral
337
-
59,416
8,346
9,344
19.6
19.9
7.8
9.0
43.2
37.5
8.7
7.9
25.2
24.8
6.7
5.9
GlaxoSmith Con*
Neutral
6,038
-
25,394
5,072
5,760
18.2
18.4
176.3
199.2
34.3
30.3
7.3
6.6
21.2
21.7
4.3
3.8
Godrej Consumer
Neutral
958
-
65,254
10,171
11,682
20.8
21.5
21.7
27.1
44.1
35.3
9.9
8.5
22.3
23.4
6.5
5.6
HUL
Neutral
1,274
-
275,755
37,077
41,508
20.3
21.8
5,189.9
6,318.5
0.3
0.2
38.8
33.2
74.8
82.0
7.3
6.5
ITC
Neutral
259
-
315,727
44,588
49,853
37.0
37.3
9.6
11.0
27.0
23.6
6.6
6.3
25.1
27.3
6.6
5.8
Marico
Neutral
304
-
39,214
6,788
7,766
18.5
19.2
7.1
8.5
42.8
35.7
15.0
12.8
36.9
38.0
5.6
4.9
Nestle*
Neutral
7,721
-
74,445
10,083
11,182
20.0
20.9
119.7
141.3
64.5
54.6
227.3
207.8
36.7
39.8
7.1
6.3
Tata Global
Neutral
275
-
17,350
7,121
7,641
11.9
12.3
6.9
8.0
39.8
34.4
2.7
2.5
6.8
7.2
2.2
2.1
Procter & Gamble
Neutral
9,066
-
29,430
3,034
3,579
27.1
27.7
167.7
198.8
54.1
45.6
14.5
12.5
28.8
29.5
9.1
7.6
Hygiene
IT
HCL Tech^
Buy
843
1,014
120,267
50,009
54,608
22.1
22.1
62.8
67.6
13.4
12.5
3.0
2.6
22.4
20.6
2.1
1.8
Infosys
Buy
961
1,120
220,821
70,333
75,960
26.0
26.0
61.7
65.9
15.6
14.6
3.0
2.7
18.9
18.7
2.5
2.3
TCS
Reduce
2,705
2,442
517,748
123,384
134,488
26.1
26.1
133.2
143.7
20.3
18.8
5.6
5.2
27.6
27.8
3.9
3.5
Tech Mahindra
Accumulate
478
526
46,681
30,545
32,988
15.0
15.0
35.2
37.6
13.6
12.7
2.3
2.1
16.8
16.2
1.3
1.1
Stock Watch
November 21, 2017
Company Name
Reco
CMP
Target
Mkt Cap
Sales ( Čcr )
OPM(%)
EPS (Č)
PER(x)
P/BV(x)
RoE(%)
EV/Sales(x)
(Č)
Price ( Č)
( Č cr )
FY18E FY19E
FY18E
FY19E
FY18E
FY19E
FY18E
FY19E
FY18E
FY19E
FY18E
FY19E
FY18E
FY19E
IT
Wipro
Neutral
295
-
143,373
54,164
56,544
22.3
22.3
18.8
19.5
15.7
15.1
2.5
2.2
15.0
13.6
1.9
1.6
Media
D B Corp
Neutral
365
-
6,719
2,404
2,625
30.5
31.5
23.7
26.9
15.4
13.6
3.6
3.1
23.5
22.8
2.6
2.4
HT Media
Neutral
99
-
2,312
2,589
2,830
15.1
15.4
8.3
10.9
12.0
9.1
1.0
0.9
8.4
10.4
0.4
0.3
Jagran Prakashan
Buy
163
225
5,060
2,541
2,835
28.5
28.7
12.7
14.1
12.8
11.5
2.7
2.3
21.3
21.4
1.8
1.6
Sun TV Network
Neutral
836
-
32,947
3,238
3,789
51.9
55.1
30.9
38.0
27.1
22.0
7.7
6.8
30.0
31.0
9.7
8.2
Hindustan Media
Neutral
243
-
1,783
1,002
1,074
23.3
23.5
29.2
33.8
8.3
7.2
1.3
1.1
15.6
15.4
0.8
0.5
Ventures
TV Today Network
Buy
374
435
2,231
667
727
27.7
27.7
18.6
20.1
20.1
18.6
3.1
3.2
15.6
17.3
2.9
2.7
Music Broadcast Limited Buy
370
434
2,113
271
317
91.0
109.0
6.0
10.0
61.7
37.0
3.9
3.5
6.5
9.3
7.4
6.1
Metals & Mining
Coal India
Neutral
278
-
172,721
82,301
91,235
17.0
18.0
17.1
20.5
16.3
13.6
3.1
2.9
45.0
55.0
1.8
1.6
Hind. Zinc
Neutral
315
-
133,076
22,108
24,555
57.0
58.0
22.1
26.3
14.3
12.0
4.6
3.7
32.0
35.0
5.0
4.2
Hindalco
Neutral
261
-
58,656
102,350
105,355
13.5
14.5
21.5
24.5
12.2
10.7
1.7
1.4
15.0
15.2
1.1
1.1
JSW Steel
Neutral
266
-
64,322
64,500
68,245
21.1
21.5
20.1
21.2
13.2
12.6
2.4
2.1
-
-
1.7
1.7
NMDC
Neutral
126
-
39,833
10,209
11,450
47.0
48.0
11.1
12.1
11.3
10.4
1.6
1.5
-
-
3.4
3.1
SAIL
Neutral
81
-
33,640
54,100
63,555
3.0
10.0
(10.0)
1.5
54.3
1.1
1.1
-
-
1.6
1.4
Vedanta
Neutral
314
-
116,683
81,206
87,345
28.0
29.0
26.5
33.5
11.9
9.4
2.7
2.3
-
-
2.2
1.9
Tata Steel
Neutral
701
-
68,053
121,445
126,500
16.2
17.2
65.4
81.3
10.7
8.6
1.7
1.5
-
-
1.1
1.0
Oil & Gas
GAIL
Neutral
458
-
77,512
53,115
52,344
14.2
15.3
30.0
31.1
15.3
14.7
1.9
1.8
-
-
1.2
1.2
ONGC
Neutral
180
-
230,998
83,111
84,934
44.2
44.9
16.4
16.9
11.0
10.7
1.3
1.2
-
-
2.6
2.6
Indian Oil Corp
Neutral
393
-
190,813
396,116
432,560
8.5
8.8
40.1
42.2
9.8
9.3
1.7
1.5
-
-
0.6
0.6
Reliance Industries
Neutral
919
-
597,602
257,711
267,438
17.0
18.2
89.1
89.5
10.3
10.3
1.0
0.9
-
-
2.0
1.9
Pharmaceuticals
Alembic Pharma
Buy
515
600
9,710
3,346
3,915
19.6
19.2
21.0
23.9
24.5
21.6
4.3
3.7
19.1
18.4
2.9
2.5
Alkem Laboratories Ltd
Accumulate
1,956
2,125
23,388
6,320
7,341
17.5
19.8
72.7
96.6
26.9
20.3
4.8
4.0
16.7
18.7
3.6
3.1
Aurobindo Pharma
Buy
707
823
41,401
17,086
19,478
22.1
22.0
44.7
51.4
15.8
13.8
3.5
2.8
24.7
22.7
2.5
2.2
Aventis*
Neutral
4,446
-
10,238
2,411
2,698
18.8
18.8
151.6
163.9
29.3
27.1
4.6
3.7
25.4
27.5
3.8
3.2
Cadila Healthcare
Neutral
446
-
45,690
11,584
13,228
20.3
20.4
18.7
21.3
23.9
21.0
5.3
4.4
24.6
22.9
3.8
3.2
Cipla
Sell
603
462
48,491
16,163
18,711
16.6
16.9
20.7
24.3
29.1
24.8
3.5
3.1
12.6
13.1
3.1
2.7
Dr Reddy's
Neutral
2,277
-
37,763
15,844
17,973
17.6
18.2
91.7
111.0
24.8
20.5
2.8
2.6
11.9
13.0
2.6
2.3
GSK Pharma*
Neutral
2,489
-
21,081
2,968
3,324
13.8
15.9
37.8
46.3
65.8
53.8
11.5
12.6
16.7
22.4
6.9
6.3
Indoco Remedies
Sell
264
153
2,430
1,154
1,310
14.9
14.9
11.3
12.7
23.3
20.8
3.3
2.9
15.0
15.0
2.2
1.9
Stock Watch
November 21, 2017
Company Name
Reco
CMP
Target
Mkt Cap
Sales ( Čcr )
OPM(%)
EPS (Č)
PER(x)
P/BV(x)
RoE(%)
EV/Sales(x)
(Č)
Price ( Č)
( Č cr )
FY18E FY19E
FY18E
FY19E
FY18E
FY19E
FY18E
FY19E
FY18E
FY19E
FY18E
FY19E
FY18E
FY19E
Pharmaceuticals
Ipca labs
Neutral
544
-
6,858
3,593
4,022
14.5
15.5
19.4
25.2
28.0
21.6
2.6
2.3
9.5
11.2
2.0
1.8
Lupin
Buy
826
1,091
37,337
16,240
18,562
21.3
21.7
42.5
49.6
19.4
16.7
2.4
2.2
13.3
13.7
2.4
2.0
Natco Pharma
Buy
903
1,057
15,759
1,886
2,016
32.3
29.5
23.2
22.0
39.0
41.0
8.2
7.2
20.9
17.6
8.2
7.7
Sun Pharma
Accumulate
516
558
123,909
32,899
36,451
26.9
25.4
31.6
32.3
16.3
16.0
2.9
2.5
18.7
18.8
3.4
2.9
Syngene International
Accumulate
525
556
10,501
1,394
1,818
33.0
36.0
15.8
20.6
33.2
25.5
6.2
5.1
18.6
20.0
7.5
5.7
Power
Tata Power
Neutral
92
-
24,803
32,547
33,806
20.5
20.5
4.7
5.4
19.5
17.1
1.9
1.6
10.5
10.5
1.7
1.7
NTPC
Neutral
180
-
148,542
86,070
101,246
28.3
30.7
12.9
16.2
14.0
11.1
1.4
1.3
10.6
12.4
3.1
2.8
Power Grid
Accumulate
209
223
109,314
29,183
32,946
89.7
90.0
18.0
20.8
11.6
10.1
1.9
1.7
17.7
18.2
7.7
7.1
Real Estate
Prestige Estate
Neutral
310
-
11,606
4,607
5,146
21.0
22.2
7.9
9.8
39.2
31.6
2.4
2.2
10.3
12.0
3.7
3.4
MLIFE
Buy
441
522
2,265
487
590
12.3
17.8
21.0
31.2
21.0
14.2
1.1
1.0
5.2
7.4
3.4
2.7
Telecom
Bharti Airtel
Neutral
493
-
196,932
97,903
105,233
36.0
36.3
9.3
11.1
53.0
44.6
2.6
2.4
5.0
5.6
3.0
2.7
Idea Cellular
Neutral
101
-
36,470
35,012
37,689
27.1
27.7
(4.4)
(2.7)
1.6
1.6
(6.8)
(4.6)
2.4
2.1
zOthers
Abbott India
Neutral
4,975
-
10,571
3,244
3,723
14.9
16.1
167.5
209.4
29.7
23.8
6.6
5.5
23.7
24.8
2.9
2.5
Asian Granito
Buy
494
570
1,486
1,169
1,286
12.5
12.5
16.0
19.7
30.9
25.1
3.3
2.9
10.7
11.6
1.5
1.3
Bajaj Electricals
Neutral
410
-
4,170
4,646
5,301
6.7
7.6
16.1
22.3
25.5
18.4
4.2
3.5
16.4
19.2
0.9
0.8
Banco Products (India)
Neutral
221
-
1,582
1,530
1,695
13.2
12.7
19.0
20.0
11.6
11.1
1.9
1.6
0.2
0.2
0.9
105.0
Coffee Day Enterprises
Neutral
225
-
4,628
3,494
3,913
17.4
18.0
4.8
5.7
-
39.4
2.0
1.9
-
0.1
1.8
1.6
Ltd
Elecon Engineering
Neutral
78
-
879
171
201
15.0
16.2
36.0
43.0
2.2
1.8
0.2
0.2
0.1
0.1
4.5
3.8
Garware Wall Ropes
Neutral
931
-
2,038
928
1,003
15.2
15.2
39.4
43.2
23.6
21.6
3.9
3.3
16.5
15.4
2.1
1.8
Goodyear India*
Neutral
819
-
1,889
1,717
1,866
11.8
12.3
47.9
49.8
17.1
16.5
2.6
2.3
15.6
15.7
0.8
113.9
Hitachi
Neutral
2,491
-
6,774
2,355
2,715
10.3
10.8
49.0
60.9
50.8
40.9
11.9
9.4
0.2
0.2
2.9
2.5
HSIL
Neutral
481
-
3,477
2,240
2,670
14.6
15.0
17.0
22.0
28.3
21.9
2.3
2.2
0.1
0.1
1.8
1.4
Interglobe Aviation
Neutral
1,172
-
45,002
22,570
27,955
14.2
15.0
63.6
81.8
18.4
14.3
9.7
8.2
0.5
0.6
1.7
1.3
Jyothy Laboratories
Neutral
333
-
6,050
1,781
2,044
14.1
15.0
9.4
10.5
35.6
31.7
7.6
7.1
0.2
0.2
3.6
3.1
Linc Pen & Plastics
Neutral
276
-
408
420
462
9.3
9.3
15.3
17.1
18.0
16.1
3.0
3.2
16.9
19.5
1.0
0.9
M M Forgings
Neutral
879
-
1,061
542
642
20.1
21.0
41.6
56.8
21.1
15.5
2.9
2.5
0.1
0.2
2.4
2.1
Mirza International
Neutral
153
-
1,844
1,148
1,285
18.0
18.0
8.0
9.4
19.1
16.4
3.2
2.7
16.3
16.1
1.8
1.5
Navkar Corporation
Buy
190
265
2,861
561
617
41.5
41.5
11.5
12.7
16.5
15.0
1.7
1.6
10.5
10.4
5.8
5.0
Nilkamal
Neutral
1,606
-
2,396
2,317
2,525
11.4
11.1
96.0
105.0
16.7
15.3
2.8
2.5
0.2
0.2
1.0
0.9
Stock Watch
November 21, 2017
Company Name
Reco
CMP
Target Mkt Cap
Sales ( Čcr )
OPM(%)
EPS (Č)
PER(x)
P/BV(x)
RoE(%)
EV/Sales(x)
(Č)
Price ( Č)
( Č cr )
FY18E FY19E FY18E FY19E FY18E FY19E FY18E FY19E FY18E FY19E FY18E FY19E FY18E FY19E
zOthers
Parag Milk Foods
Neutral
234
-
1,965
1,987
2,379
7.6
9.0
12.4
18.3
18.8
12.8
2.7
2.3
8.2
13.2
1.1
0.9
Radico Khaitan
Neutral
274
-
3,649
1,811
1,992
13.2
13.2
8.1
8.8
33.8
31.1
3.4
3.7
10.1
12.0
2.3
2.1
Relaxo Footwears
Neutral
576
-
6,936
1,981
2,310
13.7
14.5
12.0
15.5
48.0
37.2
9.4
7.6
0.2
0.2
3.6
3.1
Siyaram Silk Mills
Accumulate
579
650
2,711
1,769
1,981
12.7
12.7
22.6
26.2
25.6
22.1
4.0
3.4
15.5
15.5
1.7
1.5
Styrolution ABS India* Neutral
923
-
1,623
1,800
1,980
8.0
8.1
42.0
46.2
22.0
20.0
2.5
2.2
0.1
0.1
1.0
0.9
Surya Roshni
Neutral
374
-
1,638
4,870
5,320
7.7
7.8
22.8
28.1
16.4
13.3
2.2
1.9
0.1
0.1
0.6
0.5
TVS Srichakra
Neutral
3,326
-
2,547
2,729
2,893
12.7
12.5
248.5
265.0
13.4
12.6
3.8
3.1
0.3
0.3
0.9
0.9
Visaka Industries
Neutral
636
-
1,010
1,104
1,214
12.1
12.6
31.0
37.9
20.5
16.8
2.5
2.2
0.1
0.1
1.1
1.0
VIP Industries
Neutral
306
-
4,329
1,450
1,693
10.4
10.5
6.5
7.8
46.8
39.2
9.9
8.7
21.1
22.1
3.0
2.5
Navin Fluorine
Accumulate
683
730
3,367
945
1,154
22.4
22.6
28.7
34.8
23.8
19.7
3.9
3.4
-
-
3.1
2.4
Source: Company, Angel Research; Note: *December year end; #September year end; &October year end; Price as on November 20, 2017
Market Outlook
November 21, 2017
Research Team Tel: 022 - 39357800
DISCLAIMER
Angel Broking Private Limited (hereinafter referred to as “Angel”) is a registered Member of National Stock Exchange of India
Limited,Bombay Stock Exchange Limited and Metropolitan Stock Exchange Limited. It is also registered as a Depository Participant with
CDSL and Portfolio Manager with SEBI. It also has registration with AMFI as a Mutual Fund Distributor. Angel Broking Private Limited is a
registered entity with SEBI for Research Analyst in terms of SEBI (Research Analyst) Regulations, 2014 vide registration number
INH000000164. Angel or its associates has not been debarred/ suspended by SEBI or any other regulatory authority for accessing
/dealing in securities Market. Angel or its associates/analyst has not received any compensation / managed or
co-managed public offering of securities of the company covered by Analyst during the past twelve months.
This document is solely for the personal information of the recipient, and must not be singularly used as the basis of any investment
decision. Nothing in this document should be construed as investment or financial advice. Each recipient of this document should make
such investigations as they deem necessary to arrive at an independent evaluation of an investment in the securities of the companies
referred to in this document (including the merits and risks involved), and should consult their own advisors to determine the merits and
risks of such an investment.
Reports based on technical and derivative analysis center on studying charts of a stock's price movement, outstanding positions and
trading volume, as opposed to focusing on a company's fundamentals and, as such, may not match with a report on a company's
fundamentals. Investors are advised to refer the Fundamental and Technical Research Reports available on our website to evaluate the
contrary view, if any.
The information in this document has been printed on the basis of publicly available information, internal data and other reliable
sources believed to be true, but we do not represent that it is accurate or complete and it should not be relied on as such, as this
document is for general guidance only. Angel Broking Pvt. Limited or any of its affiliates/ group companies shall not be in any way
responsible for any loss or damage that may arise to any person from any inadvertent error in the information contained in this report.
Angel Broking Pvt. Limited has not independently verified all the information contained within this document. Accordingly, we cannot
testify, nor make any representation or warranty, express or implied, to the accuracy, contents or data contained within this document.
While Angel Broking Pvt. Limited endeavors to update on a reasonable basis the information discussed in this material, there may be
regulatory, compliance, or other reasons that prevent us from doing so.
This document is being supplied to you solely for your information, and its contents, information or data may not be reproduced,
redistributed or passed on, directly or indirectly.
Neither Angel Broking Pvt. Limited, nor its directors, employees or affiliates shall be liable for any loss or damage that may arise from
or in connection with the use of this information.